Leverage Geospatial Elements

Project Brief.
It is estimated that 80% of data collected contains a spatial element to it. What impact does geography have on your business? Where are things heating up and cooling down?
Map it!
- Visualize your Data Geographically
- Identify “Hot Spots”
- Zoom and Pan the Globe
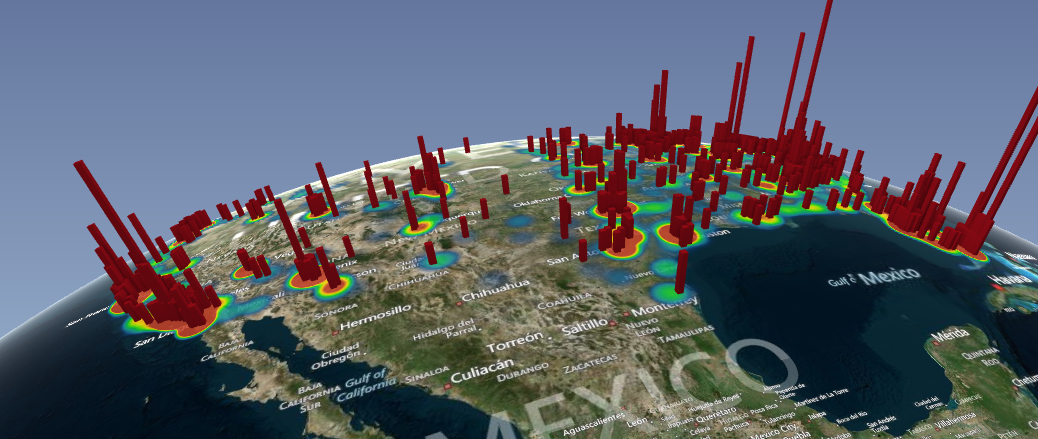
Please view our tour below showing an example of Power Maps. The tour visualizes credit card complaints via a heat map. The map is then augmented with a column chart indicating how many of these complaints were due to ID theft. You may not want to use your credit card in certain areas on vacation!!
http://artofanalytics.com/wp/wp-content/uploads/2014/05/ID-Theft.mp4